Monitoring with Shinken

By Shai Coleman
March 2014
About me
- My name is Shai Coleman
- I love technology
- Freelance Tech Lead, DevOps and Ruby Developer
- Developed the Colemak keyboard layout
Monitoring is essential
- Be the first to know
- Identify the root cause
- Understand what went wrong
- Extrapolate trends
- Plan for the future
- Identify regressions
- Minimise damage
Downtime sucks
- Losing customers and sales
- Tarnishes your brand
- Paralyzes the team
- Clean up time and costs
- It will happen at the worst possible time
Monitor Everything
- Availability
- Latency
- Throughput
- Behaviour
- Resources (CPU, RAM, Disk, Network)
- Assets (files, etc.)
- Queues
- Databases
- Events (exceptions, logs)
- External dependencies
Compared to SaaS Solutions
- Open Source
- Not tied to one cloud or platform
- Flexibility
- Security
- Control
- Text files are more flexible than GUIs/APIs
- No operating costs
- No disincentive for monitoring
- Version control
- Automatable
A better Nagios
- Scalable to millions of checks
- Clean codebase
- Compatible with Nagios configurations & plugins
- Written in Python
- Modular Design (shinken install package)
- Service generators (duplicate_foreach)
- Fully open source, GitHub development
- Business impact intelligence
- AGPL license
- Distributed and Scalable
Distributed Architecture
- Arbiter: Reads the config, monitors daemons, manages HA.
- Scheduler: Queues and Schedules for Poller/Reactionner
- Poller: Launches checks
- Reactionner: Handles notifications and events.
- Broker: Manages data (logging, graphing)
- Receiver: Handles passive checks
- WebUI: Shinken WebUI/Thruk/Multisite
- Graphs: Graphite/RRDTool
- Modules from Shinken.io
System Requirements
- Python: 2.7 recommended
- RAM: 512MB
- Disk: 10GB
- Install on a separate VM
Shinken WebUI
- Can do searches
- Has a mobile version
- View graphs
- Set scheduled downtimes
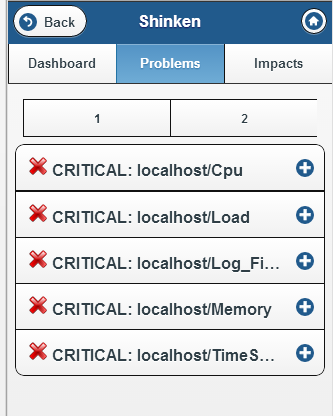
Mobile WebUI
Monitor early,
monitor often
/etc/shinken/shinken.cfg
# check immediately after reload
max_service_check_spread=0
max_host_check_spread=0
/etc/shinken/templates/generic-host.cfg
# check every minute
check_interval 1
# consider down after 10 minutes
max_check_attempts  10
Master config file
/etc/shinken/shinken.cfg
- The master shinken configuration file
- cfg_dir: include all config files in the diretory
- cfg_file: include a single config file
Commands
/etc/shinken/commands/http.cfg
A custom commands that check HTTP/HTTPS response
# Syntax: check_command http!server!/path!content
define command {
    command_name    http
    command_line    $PLUGINSDIR$/check_http $ARG4$ $ARG5$
                    -H "$ARG1$" -u "$ARG2$" -s "$ARG3$"
}

# Syntax: check_command https!server!/path!content
define command {
    command_name    https
    command_line    $PLUGINSDIR$/check_http $ARG4$ $ARG5$ --ssl
                    -H "$ARG1$" -u "$ARG2$" -s "$ARG3$"
}
Services
/etc/shinken/hosts/example.com.cfg
An example host with a sample service
define host {
    use                     generic-host,linux,linux-snmp
    contact_groups          admins
    host_name               example.com
    max_check_attempts      15
    _fs                     /,/home,/var,/tmp
}

define service {
    use                 generic-service
    host_name           example.com
    service_description HTTP example.com
    check_command       https!example.com!/login!google-analytics.com
}
SNMP
Simple Network Management Protocol
- v1: Legacy SNMP version. Limited to 32bit counters.
- v2c: Recommended for simplicity.
- v3: Adds authentication and encryption.
More complicated and slower.
SNMP security
- Restrict by host as a minimum
- Restrict network interfaces
- Limit access to specific OIDs
- Change the community name from public to something else
- Use SNMP v3 with authentication/encryption
Install SNMP server
apt-get install snmpd/etc/snmpd/snmpd.conf
# listen on all interfaces
agentAddress udp:161,udp6:[::1]:161

# allow all OIDs to be queried
view   systemonly  included   .1

# restrict by host
rocommunity public  shinken.example.com
Monitoring within your app
Create a URL path in your web apps that monitors
the various aspects of the app, e.g.
- Test connection to the database
- Test the message queue
- Count rows in your biggest table
Make sure that it prints a success message
and check that via Shinken
Custom SNMP commands
- Download the check_snmp_extend.py plugin
- apt-get install snmp-mibs-downloader on Shinken
/etc/shinken/commands/extend.cfg
# Syntax: check_command extend!server!command
define command {
    command_name    extend
    command_line    $PLUGINSDIR$/check_snmp_extend.py -H "$ARG1$" -e "$ARG2$"
}
/etc/snmpd/snmpd.conf
extend    mailq   /bin/bash -c
"MAILQ=$(/usr/bin/find /var/mailq -nowarn -type f | wc -l);
STATUS=OK; CODE=0;
[ \"$MAILQ\" -ge 50 ] && STATUS=WARNING && CODE=1;
echo \"$STATUS: $MAILQ mails|mailq=$MAILQ\";
exit $CODE"
Questions?
Thank you!
Contact Me
- Slides: shaicoleman.com/slides/shinken
- Email: shaicoleman.com/email
- LinkedIn: shaicoleman.com/in
Links
- Website: shinken-monitoring.org
- Forum: shinken-monitoring.org/forum
- Commercial Support: shinken-solutions.com
- IRC: #shinken on Freenode